

The stock market ended Friday's holiday-shortened session on a mixed note, but overall, things held up pretty well. The main indices showed nice resilience [SPX $4026.11, -$1.16, -.03%] to selling efforts on below-average volume despite a decent hit to Apple (AAPL $148.11, -$2.96, -2.0%). Early in the day, Reuters reported that iPhone production in November is projected to be curtailed by at least 30% at the Foxconn facility due to worker unrest that stems from pay disputes and COVID concerns. On a related note, record high COVID cases have prompted more lockdown measures that have reportedly brought Beijing to a near standstill... again.
Coincidentally, China announced new stimulus measures, including more credit support for property developers. The People's Bank of China also announced a 25 basis point cut in the required reserve ratio for most banks, which will free roughly CNY500 bln of liquidity, starting December 5th.
The lack of participation today was reflected S&P 500 sector performance. None of the 11 sectors moved more than 0.7% in either direction. The "biggest" move was made by the communication services sector (-0.7%), which was weighed down by Activision (ATVI $73.47, -$3.12, -4.1%). The company sold off on news that the FTC may file an antitrust lawsuit to block Microsoft's (MSFT $247.49, -$0.09, -0.04%) acquisition of Activision.
On the flip side, the real estate (+0.6%) and utilities (+0.6%) sectors sat atop the leaderboard.
Treasury yields climbed off overnight lows today. The 10-yr note yield, which hit 3.65% overnight, sits at 3.71% now. The 2-yr note yield, which hit 4.43% overnight, sits at 4.48% now.
There was no U.S. economic data of note.

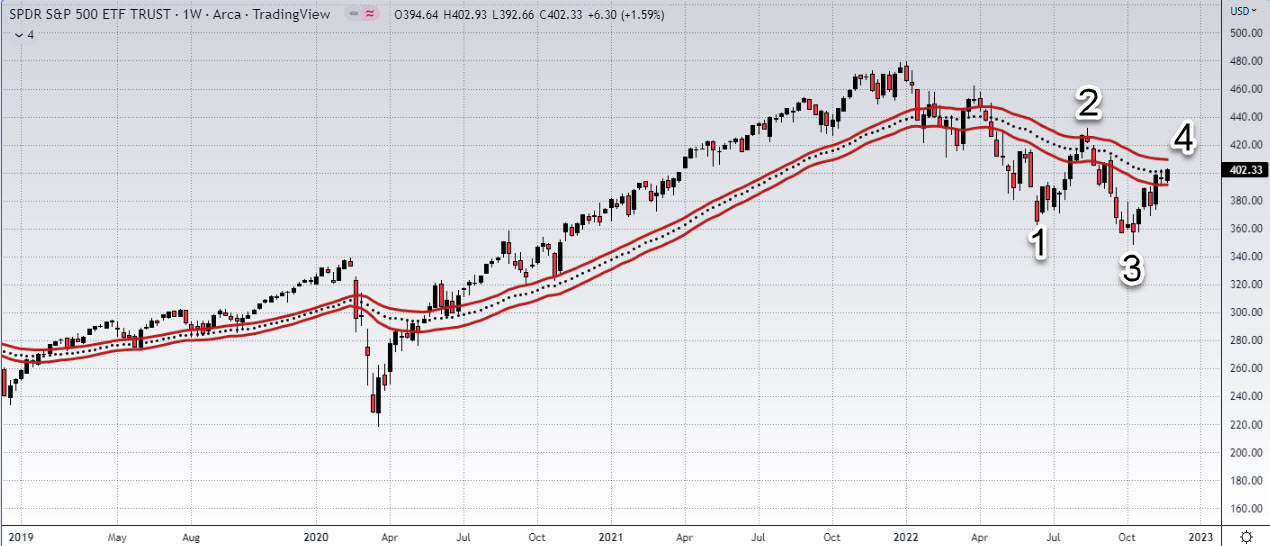
Weekly -- The weekly chart here shows how it's possible to have competing trends... in the same security. Given the lower low [3] relative to [1] and the lower high [4] relative to [2], it's tough to get long unless price can exceed [2] before breaching [3] to the downside.
Daily - the daily chart confirms the weekly in much the way you would expect...[1] is the relative high and [2] is the relative low. I wouldn't worry about [or think about for that matter] trying to get long based on this chart unless an price can exceed [1] to the upside.

Bottom Line: #SPY is in the throes of making a decision about the next trend. If you're a SPY trader, I suggest you wait for some clarity before entering.
If you're not yet a SPY trader, and think you'd like to learn more in order to head into 2023 well prepared to begin extracting side hustle profits from the market, grab a free subscription to my substack newsletter to stay up to date and be alerted when there's chance to join my team.
In any case, I hope this helps.
