
The VIX is a real-time index that reflects the expected level of price fluctuation in the S&P 500 Index options over the next 12 months. Officially called the CBOE Volatility Index, traders also refer to it as the “fear index.”
Translation: The VIX is what’s called contra indicated… meaning when it goes up, stock market prices fall and vice versa. The relationship is far from perfect, but I [like other traders] find that the VIX is definitely a useful indicator to watch if for no other reason than the extremes as they tend to be far more predictive of both direction and strength of movement in the S&P 500 Index.
The VIX doesn’t measure the same kind of volatility as most other indicators. True volatility is the level of price fluctuation that can be observed by looking at past data. The VIX looks at expectations of future volatility, also known as implied volatility. Times of greater uncertainty (more expected future volatility) result in higher VIX values [sometimes spikes], while less anxious times correspond with lower values.
The first VIX index was released by CBOE Global Markets in 1993. Initially, the index only took into consideration the implied volatility of eight separate S&P 100 put and call options. After 2002, the CBOE expanded the VIX to the S&P 500 to better capture the market sentiment. VIX futures were added in 2004 and VIX options followed in 2006.
VIX values are quoted in percentage points and are supposed to predict the price movement in the S&P 500 over the following 30 days. This value is then annualized to cover the upcoming 12-month period. The VIX formula is calculated as the square root of the par variance swap rate over those first 30 days, also known as the risk-neutral expectation. This formula was developed by Vanderbilt University Professor Robert Whaley in 1993.
Traders across all timeframes and methods look to the CBOE Volatility Index as a way to measure market stress before they make decisions. When VIX returns are higher, market participants are more likely to pursue strategies with lower risk.
Here’s a video from the CBOE explaining how the VIX works.

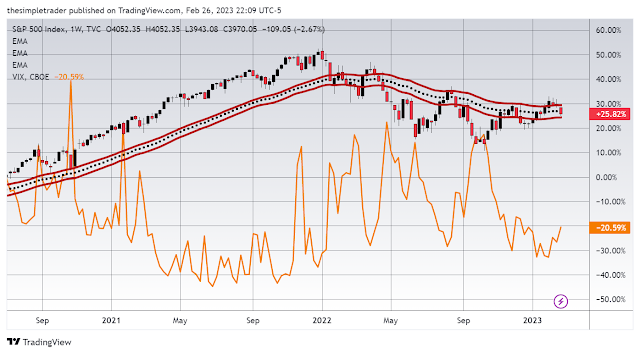
The uncomplicated explanation is that when traders expect near-term stock prices to fall, they purchase protection in the form of put options and futures contracts driving the VIX higher [represented here by the orange line]. The market makers who sell those securities offset their own risk by selling the underlying stocks and indices. The selling is often enough to create pressure on the market leading to the self-fulfilling reaction of a general fall in stock prices.
As traders cover their short option and futures positions, the VIX falls and leads to a general rise in the underlying stocks and indices.
As traders cover their short option and futures positions, the VIX falls and leads to a general rise in the underlying stocks and indices.
